Monitoring Optimisation#
In this notebook we cover how to monitor the model and certain metrics during optimisation.
Setup#
[1]:
import matplotlib.pyplot as plt
import numpy as np
import tensorflow as tf

import gpflow
from gpflow.ci_utils import reduce_in_tests

np.random.seed(0)
2022-10-13 08:53:07.394487: I tensorflow/core/platform/cpu_feature_guard.cc:193] This TensorFlow binary is optimized with oneAPI Deep Neural Network Library (oneDNN) to use the following CPU instructions in performance-critical operations:  AVX2 AVX512F FMA
To enable them in other operations, rebuild TensorFlow with the appropriate compiler flags.
2022-10-13 08:53:07.516295: W tensorflow/stream_executor/platform/default/dso_loader.cc:64] Could not load dynamic library 'libcudart.so.11.0'; dlerror: libcudart.so.11.0: cannot open shared object file: No such file or directory
2022-10-13 08:53:07.516316: I tensorflow/stream_executor/cuda/cudart_stub.cc:29] Ignore above cudart dlerror if you do not have a GPU set up on your machine.
2022-10-13 08:53:07.544894: E tensorflow/stream_executor/cuda/cuda_blas.cc:2981] Unable to register cuBLAS factory: Attempting to register factory for plugin cuBLAS when one has already been registered
2022-10-13 08:53:08.164334: W tensorflow/stream_executor/platform/default/dso_loader.cc:64] Could not load dynamic library 'libnvinfer.so.7'; dlerror: libnvinfer.so.7: cannot open shared object file: No such file or directory
2022-10-13 08:53:08.164399: W tensorflow/stream_executor/platform/default/dso_loader.cc:64] Could not load dynamic library 'libnvinfer_plugin.so.7'; dlerror: libnvinfer_plugin.so.7: cannot open shared object file: No such file or directory
2022-10-13 08:53:08.164407: W tensorflow/compiler/tf2tensorrt/utils/py_utils.cc:38] TF-TRT Warning: Cannot dlopen some TensorRT libraries. If you would like to use Nvidia GPU with TensorRT, please make sure the missing libraries mentioned above are installed properly.
/home/circleci/project/gpflow/experimental/utils.py:42: UserWarning: You're calling gpflow.experimental.check_shapes.decorator.check_shapes which is considered *experimental*. Expect: breaking changes, poor documentation, and bugs.
  warn(
/home/circleci/project/gpflow/experimental/utils.py:42: UserWarning: You're calling gpflow.experimental.check_shapes.inheritance.inherit_check_shapes which is considered *experimental*. Expect: breaking changes, poor documentation, and bugs.
  warn(
The monitoring functionality lives in gpflow.monitor. For now, we import ModelToTensorBoard, ImageToTensorBoard, ScalarToTensorBoard monitoring tasks and MonitorTaskGroup and Monitor.
[2]:
from gpflow.monitor import (
    ImageToTensorBoard,
    ModelToTensorBoard,
    Monitor,
    MonitorTaskGroup,
    ScalarToTensorBoard,
)
Set up data and model#
[3]:
# Define some configuration constants.

num_data = 100
noise_std = 0.1
optimisation_steps = reduce_in_tests(100)
[4]:
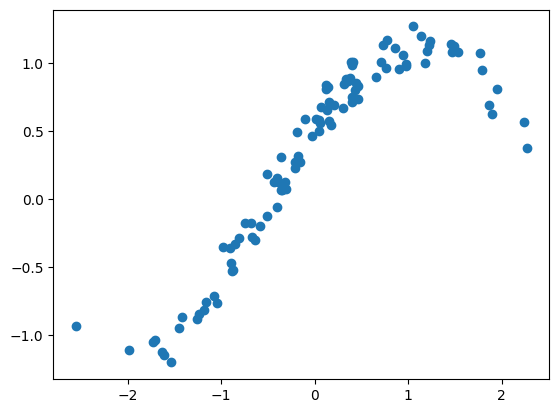
# Create dummy data.

X = np.random.randn(num_data, 1)  # [N, 2]
Y = (
    np.sin(X) + 0.5 * np.cos(X) + np.random.randn(*X.shape) * noise_std
)  # [N, 1]
plt.plot(X, Y, "o")
[4]:
[<matplotlib.lines.Line2D at 0x7f0751fe5ed0>]
[5]:
# Set up model and print

kernel = (
    gpflow.kernels.SquaredExponential(lengthscales=[1.0, 2.0])
    + gpflow.kernels.Linear()
)
model = gpflow.models.GPR((X, Y), kernel, noise_variance=noise_std ** 2)
model
/home/circleci/project/gpflow/experimental/utils.py:42: UserWarning: You're calling gpflow.experimental.check_shapes.checker.ShapeChecker.__init__ which is considered *experimental*. Expect: breaking changes, poor documentation, and bugs.
  warn(
2022-10-13 08:53:10.830462: W tensorflow/stream_executor/platform/default/dso_loader.cc:64] Could not load dynamic library 'libcuda.so.1'; dlerror: libcuda.so.1: cannot open shared object file: No such file or directory
2022-10-13 08:53:10.830493: W tensorflow/stream_executor/cuda/cuda_driver.cc:263] failed call to cuInit: UNKNOWN ERROR (303)
2022-10-13 08:53:10.830511: I tensorflow/stream_executor/cuda/cuda_diagnostics.cc:156] kernel driver does not appear to be running on this host (2b87543b4218): /proc/driver/nvidia/version does not exist
2022-10-13 08:53:10.830748: I tensorflow/core/platform/cpu_feature_guard.cc:193] This TensorFlow binary is optimized with oneAPI Deep Neural Network Library (oneDNN) to use the following CPU instructions in performance-critical operations:  AVX2 AVX512F FMA
To enable them in other operations, rebuild TensorFlow with the appropriate compiler flags.
[5]:
| name | class | transform | prior | trainable | shape | dtype | value |
|---|---|---|---|---|---|---|---|
| GPR.kernel.kernels[0].variance | Parameter | Softplus | True | () | float64 | 1.0 | |
| GPR.kernel.kernels[0].lengthscales | Parameter | Softplus | True | (2,) | float64 | [1. 2.] | |
| GPR.kernel.kernels[1].variance | Parameter | Softplus | True | () | float64 | 1.0 | |
| GPR.likelihood.variance | Parameter | Softplus + Shift | True | () | float64 | 0.01 |
[6]:
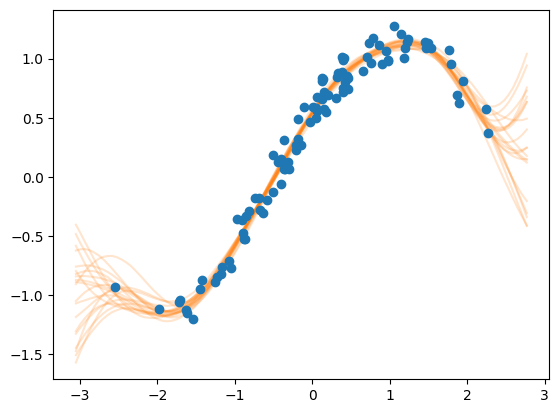
# We define a function that plots the model's prediction (in the form of samples) together with the data.
# Importantly, this function has no other argument than `fig: matplotlib.figure.Figure` and `ax: matplotlib.figure.Axes`.


def plot_prediction(fig, ax):
    Xnew = np.linspace(X.min() - 0.5, X.max() + 0.5, 100).reshape(-1, 1)
    Ypred = model.predict_f_samples(Xnew, full_cov=True, num_samples=20)
    ax.plot(Xnew.flatten(), np.squeeze(Ypred).T, "C1", alpha=0.2)
    ax.plot(X, Y, "o")


# Let's check if the function does the desired plotting
fig = plt.figure()
ax = fig.subplots()
plot_prediction(fig, ax)
plt.show()
Set up monitoring tasks#
We now define the MonitorTasks that will be executed during the optimisation. For this tutorial we set up three tasks: - ModelToTensorBoard: writes the models hyper-parameters such as likelihood.variance and kernel.lengthscales to a TensorBoard. - ImageToTensorBoard: writes custom matplotlib images to a TensorBoard. - ScalarToTensorBoard: writes any scalar value to a TensorBoard. Here, we use it to write the model’s training objective.
[7]:
log_dir = "logs"  # Directory where TensorBoard files will be written.
model_task = ModelToTensorBoard(log_dir, model)
image_task = ImageToTensorBoard(log_dir, plot_prediction, "image_samples")
lml_task = ScalarToTensorBoard(
    log_dir, lambda: model.training_loss(), "training_objective"
)
We now group the tasks in a set of fast and slow tasks and pass them to the monitor. This allows us to execute the groups at a different frequency.
[8]:
# Plotting tasks can be quite slow. We want to run them less frequently.
# We group them in a `MonitorTaskGroup` and set the period to 5.
slow_tasks = MonitorTaskGroup(image_task, period=5)

# The other tasks are fast. We run them at each iteration of the optimisation.
fast_tasks = MonitorTaskGroup([model_task, lml_task], period=1)

# Both groups are passed to the monitor.
# `slow_tasks` will be run five times less frequently than `fast_tasks`.
monitor = Monitor(fast_tasks, slow_tasks)
[9]:
training_loss = model.training_loss_closure(
    compile=True
)  # compile=True (default): compiles using tf.function
opt = tf.optimizers.Adam()

for step in range(optimisation_steps):
    opt.minimize(training_loss, model.trainable_variables)
    monitor(step)  # <-- run the monitoring
TensorBoard is accessible through the browser, after launching the server by running tensorboard --logdir ${logdir}. See the TensorFlow documentation on TensorBoard for more information.
For optimal performance, we can also wrap the monitor call inside tf.function:#
[10]:
opt = tf.optimizers.Adam()

log_dir_compiled = f"{log_dir}/compiled"
model_task = ModelToTensorBoard(log_dir_compiled, model)
lml_task = ScalarToTensorBoard(
    log_dir_compiled, lambda: model.training_loss(), "training_objective"
)
# Note that the `ImageToTensorBoard` task cannot be compiled, and is omitted from the monitoring
monitor = Monitor(MonitorTaskGroup([model_task, lml_task]))
In the optimisation loop below we use tf.range (rather than Python’s built-in range) to avoid re-tracing the step function each time.
[11]:
@tf.function
def step(i):
    opt.minimize(model.training_loss, model.trainable_variables)
    monitor(i)


# Notice the tf.range
for i in tf.range(optimisation_steps):
    step(i)
When opening TensorBoard, you may need to use the command tensorboard --logdir . --reload_multifile=true, as multiple FileWriter objects are used.
Scipy Optimization monitoring#
Note that if you want to use the Scipy optimizer provided by GPflow, and want to monitor the training progress, then you need to simply replace the optimization loop with a single call to its minimize method and pass in the monitor as a step_callback keyword argument:
[12]:
opt = gpflow.optimizers.Scipy()

log_dir_scipy = f"{log_dir}/scipy"
model_task = ModelToTensorBoard(log_dir_scipy, model)
lml_task = ScalarToTensorBoard(
    log_dir_scipy, lambda: model.training_loss(), "training_objective"
)
image_task = ImageToTensorBoard(log_dir_scipy, plot_prediction, "image_samples")

monitor = Monitor(
    MonitorTaskGroup([model_task, lml_task], period=1),
    MonitorTaskGroup(image_task, period=5),
)
[13]:
opt.minimize(training_loss, model.trainable_variables, step_callback=monitor)
[13]:
      fun: -69.68099880889176
 hess_inv: <5x5 LbfgsInvHessProduct with dtype=float64>
      jac: array([-2.96735870e-04, -4.30340722e-04,  3.97828780e-04,  2.26010527e-06,
        4.29141705e-04])
  message: 'CONVERGENCE: REL_REDUCTION_OF_F_<=_FACTR*EPSMCH'
     nfev: 37
      nit: 28
     njev: 37
   status: 0
  success: True
        x: array([  2.07005976,   1.74612938,   0.18194306, -15.21875135,
        -4.53840856])
[ ]: